

Over the last few days we published posts showing how Canada’s retaliatory tariffs impact U.S. state exports by both value and share of exports covered. Those are based on the revised product list, which was released one day after the original retaliation list announcement. Today’s post covers the U.S. winners and losers of the changes.
What changed? Most notably, 254 tariff lines of seafood products were removed the list. They were replaced by an equivalent value of exports of 9 tariff lines with much higher values like copper wires, charcoal, printed pictures, drywall and glass containers. The composition of the rest of the list remained the same.
These discrete changes had a drastic impact for a handful of states. As the graph below shows, the biggest winners were coastal states with major seafood industries. The biggest losers tended to be industrial states.
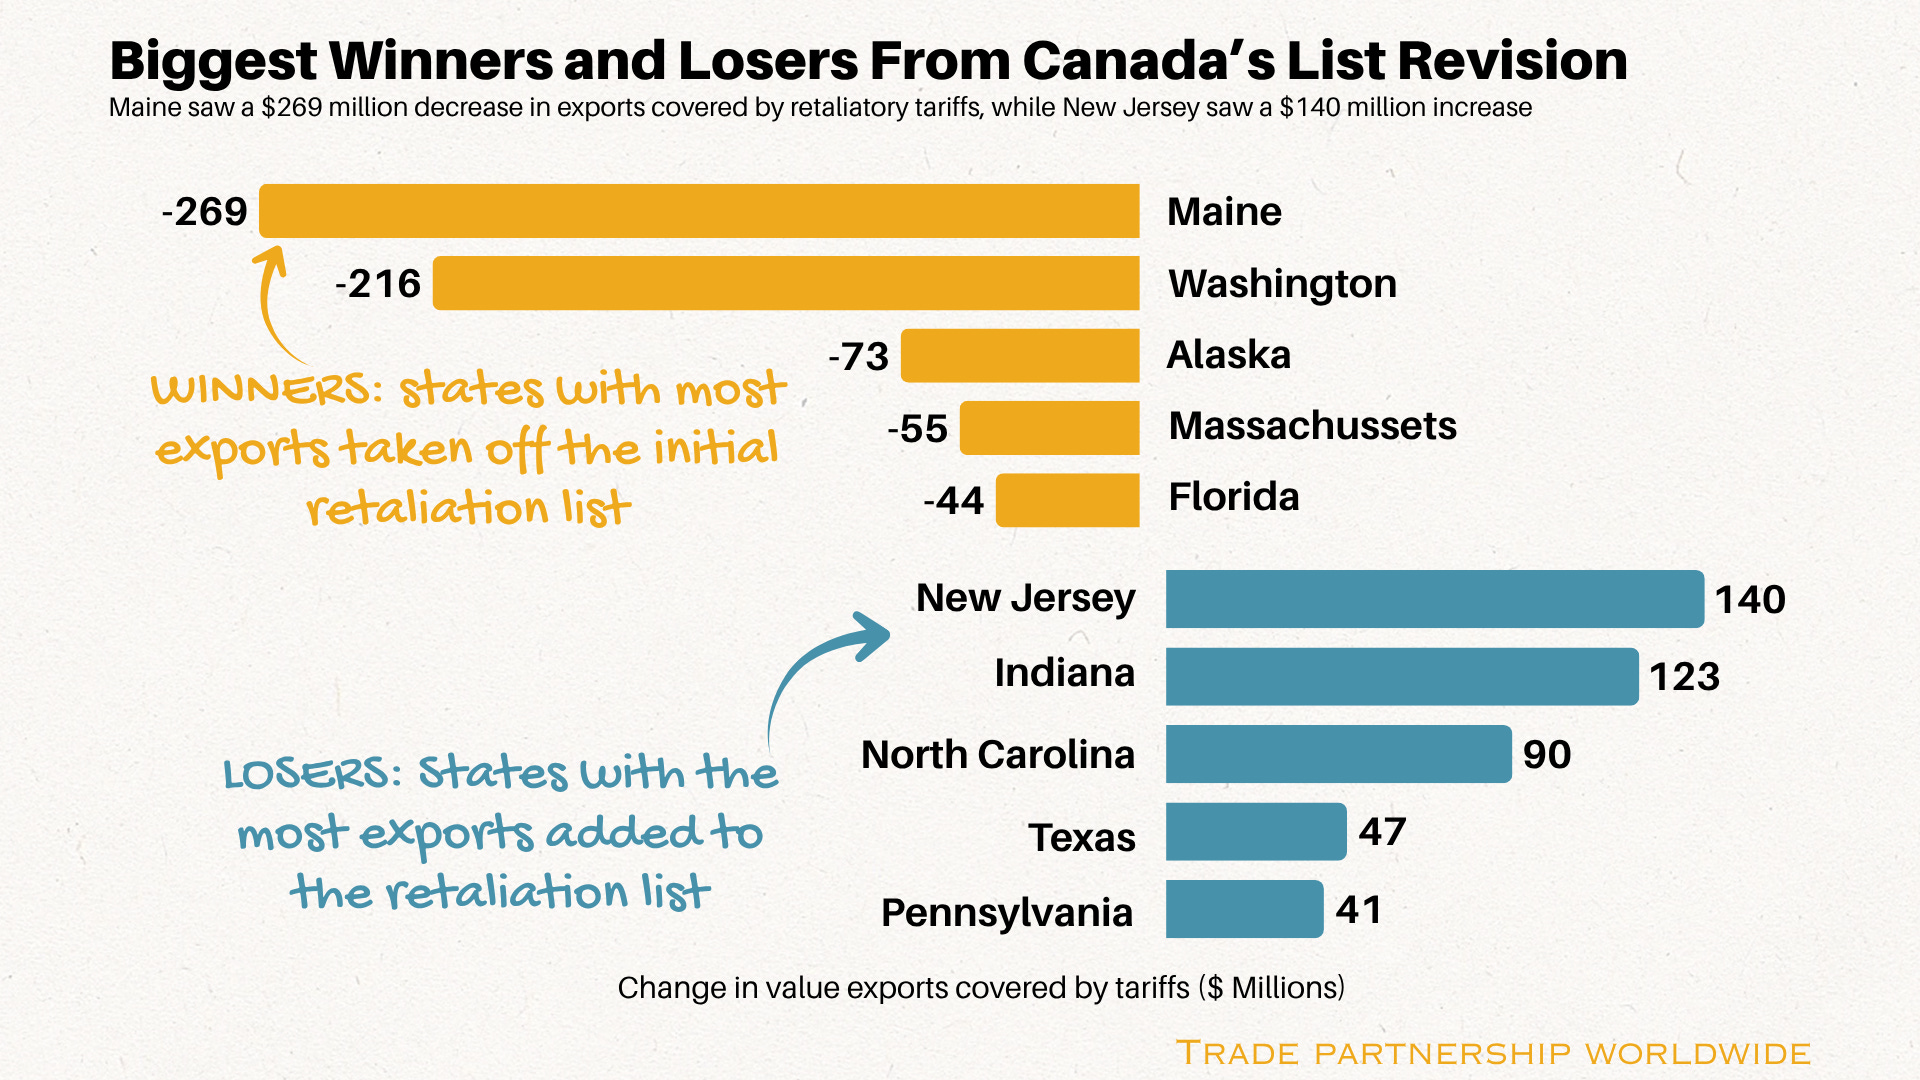
Of the states not listed in the graph, two-thirds saw their covered export values increase due to revisions, including 4 more states (New York, Ohio, Kentucky, West Virginia) where the covered value increased by $20-$40 million. By contrast, the “winners” list really ends with those 5 states: the 13 states with export reductions had only $23 million in exports removed combined.
Who were the big winners from the changes?
Maine
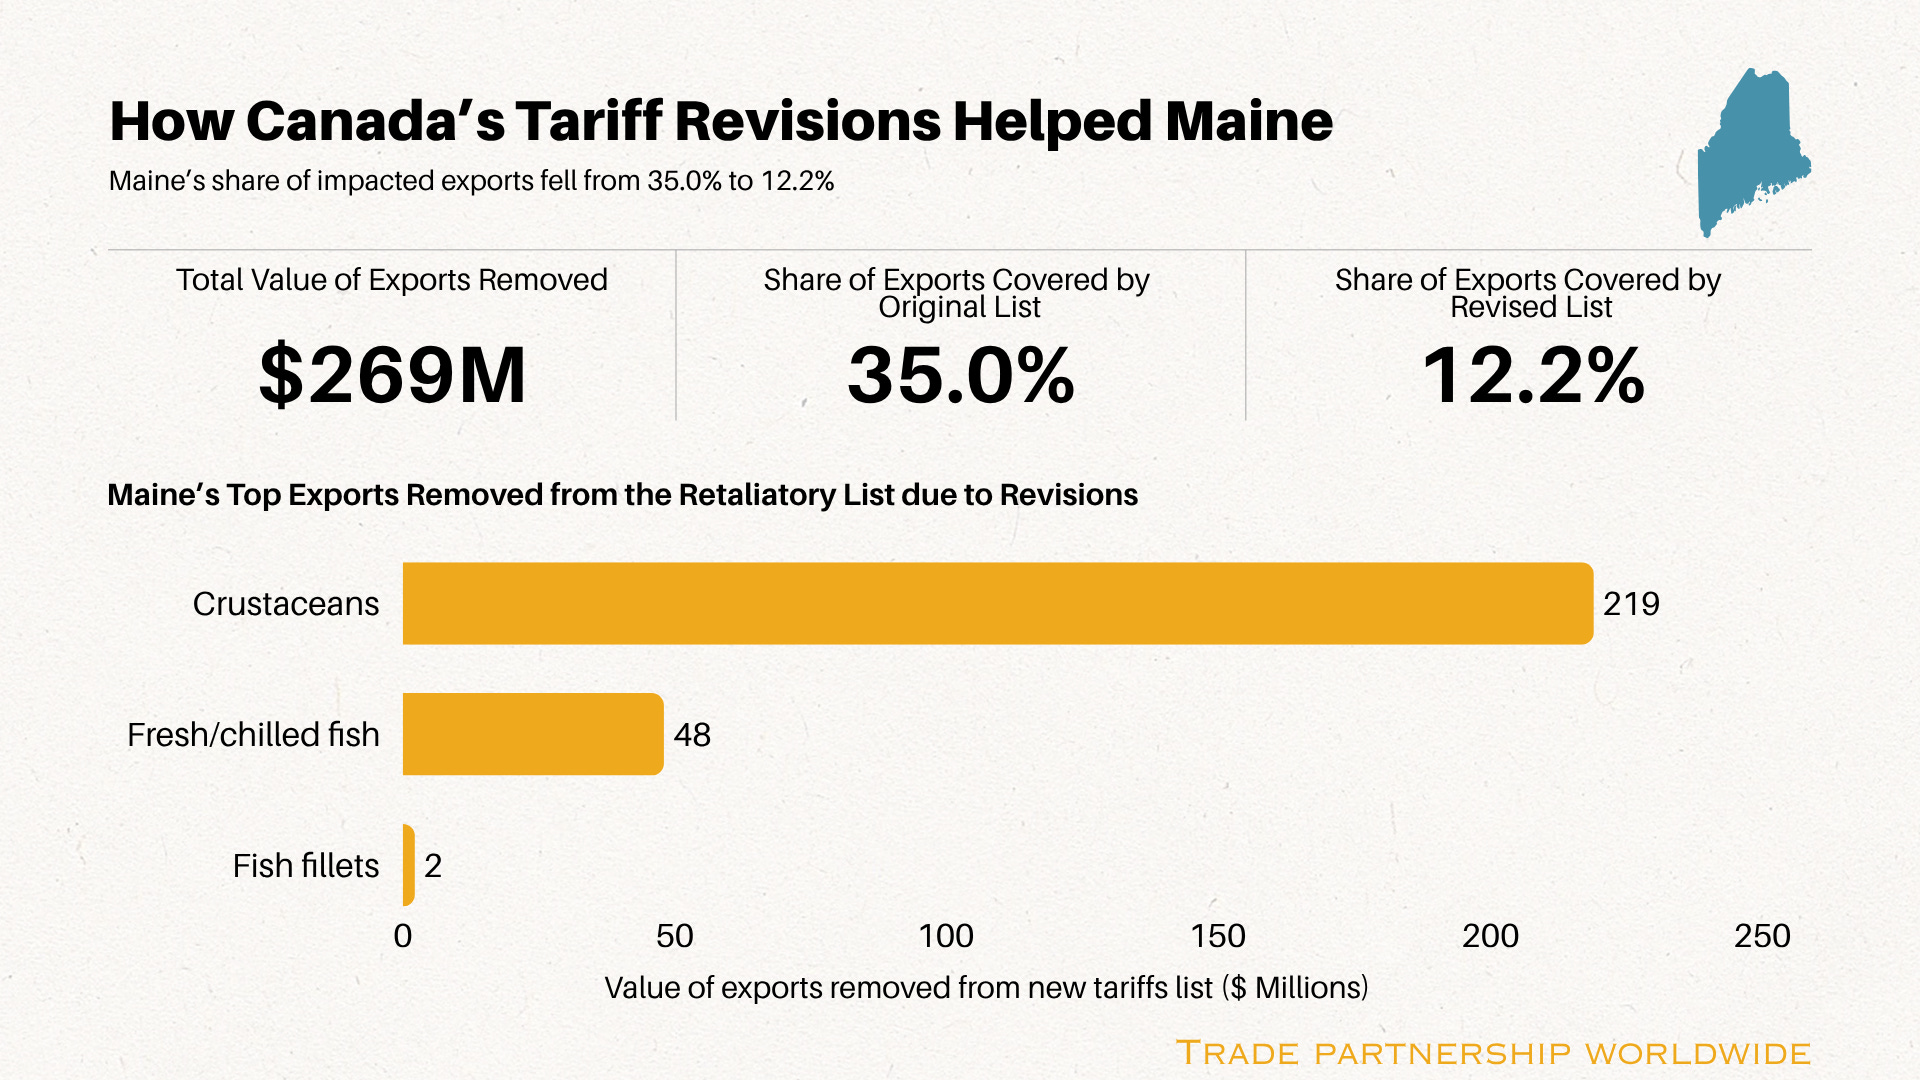
Had we published this immediately after Canada first announced retaliation, Maine would have been the most-impacted state. By a WIDE margin. Under the initial tariff list, 35% of its exports to Canada would have been hit, nearly double the next highest state. Because more than half of those exports were fish and seafood products, almost two-thirds of impacts exports were spared by the revision. After the revisions, Maine ranks just 11th in terms of share of exports subject to tariffs.
Among Maine’s seafood exports that got removed from the list: crustaceans, primarily live but also some frozen lobsters, as well as fresh or chilled fish, most notably Atlantic salmon. The exempted fish fillets are also primarily salmon..
Washington
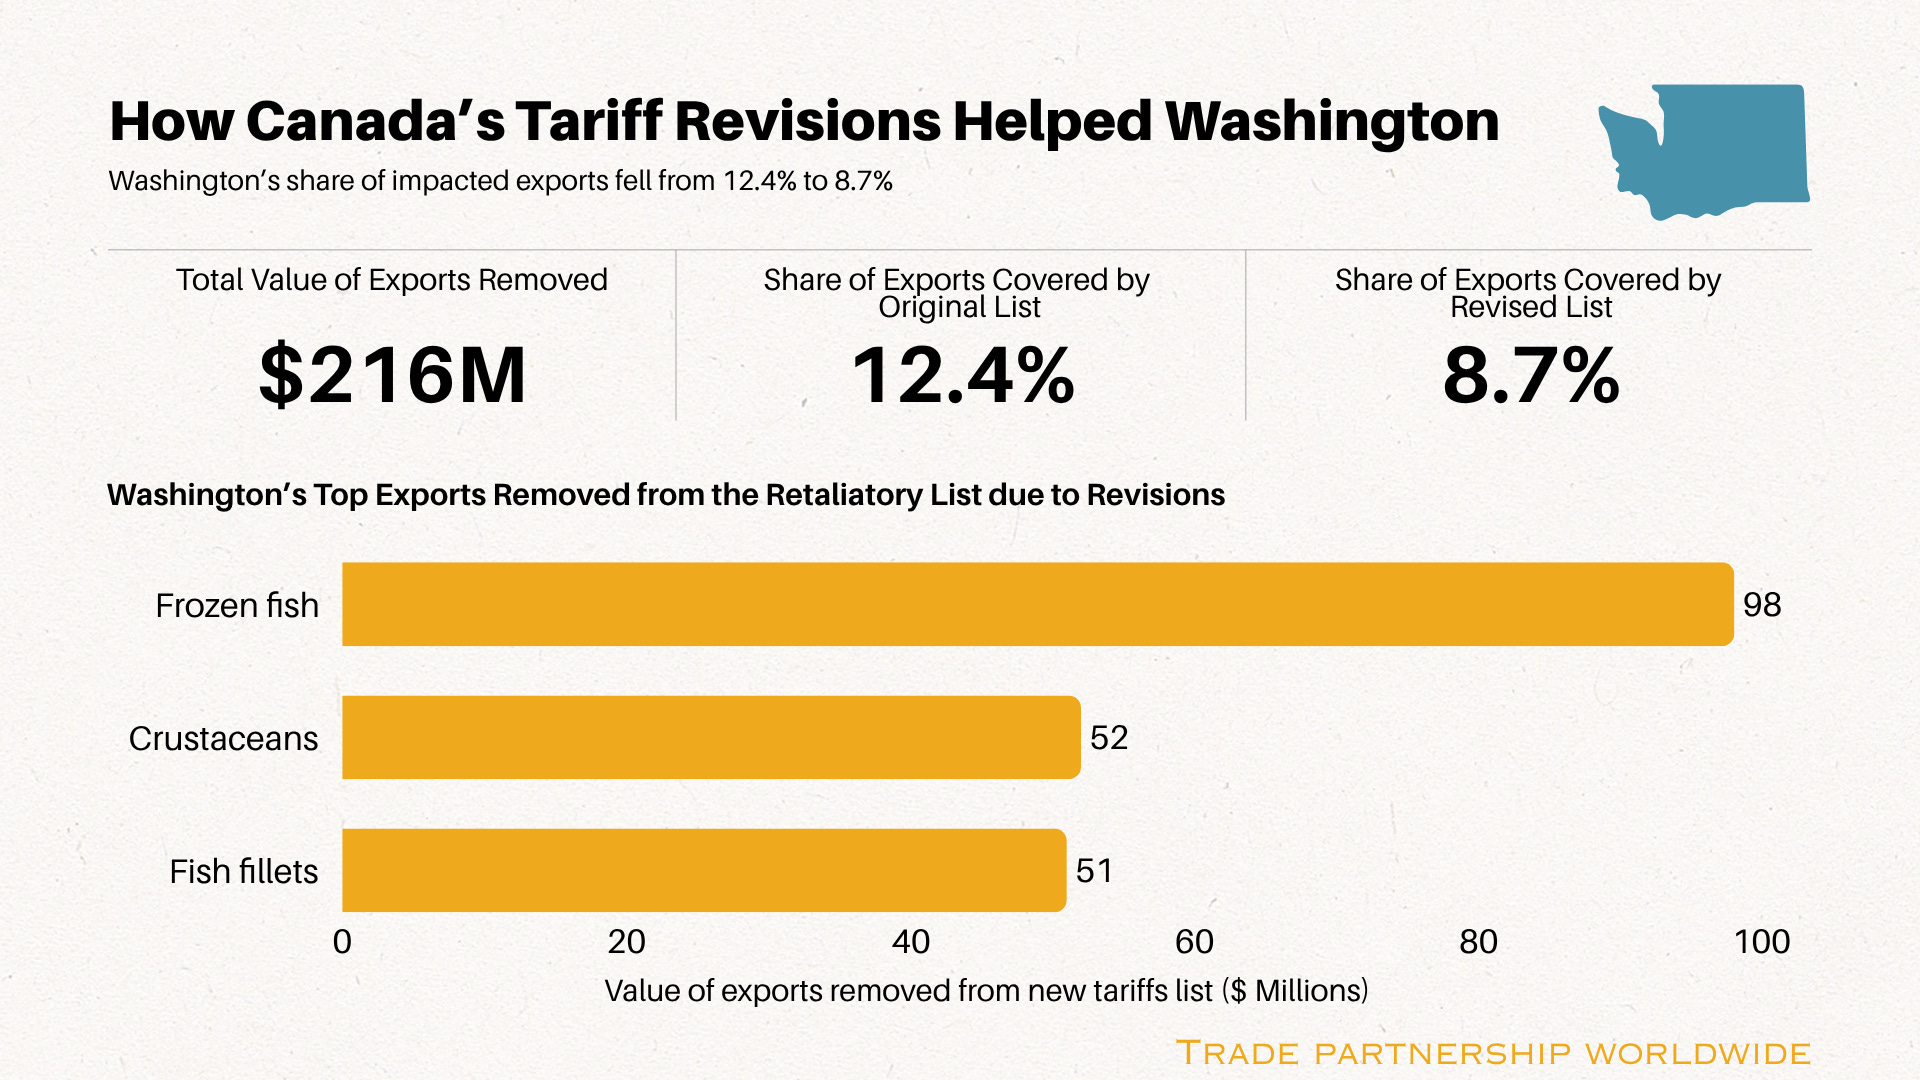
Washington also gained significantly from the removal of seafood, but for a more diversified slate of products. After the revision, Washington fell from 11th to 24th most impacted by share of exports subject to tariffs, with its share of exports impacted falling from 12.4% to 8.7%.
Among the frozen fish now exempted, sockeye salmon is the most important export to Canada for Washington, with smaller amounts of tuna, Pacific salmon, and cod accounting for most of the rest. Live crabs and crab meat products (e.g., smoked crab). Washington’s decrease in exports covered was driven by fish, crustaceans and fish fillets. Fish fillets include frozen salmon, cod, pollock, and others. The three main product categories accounted for 93% of the decrease of the exports covered.
Alaska
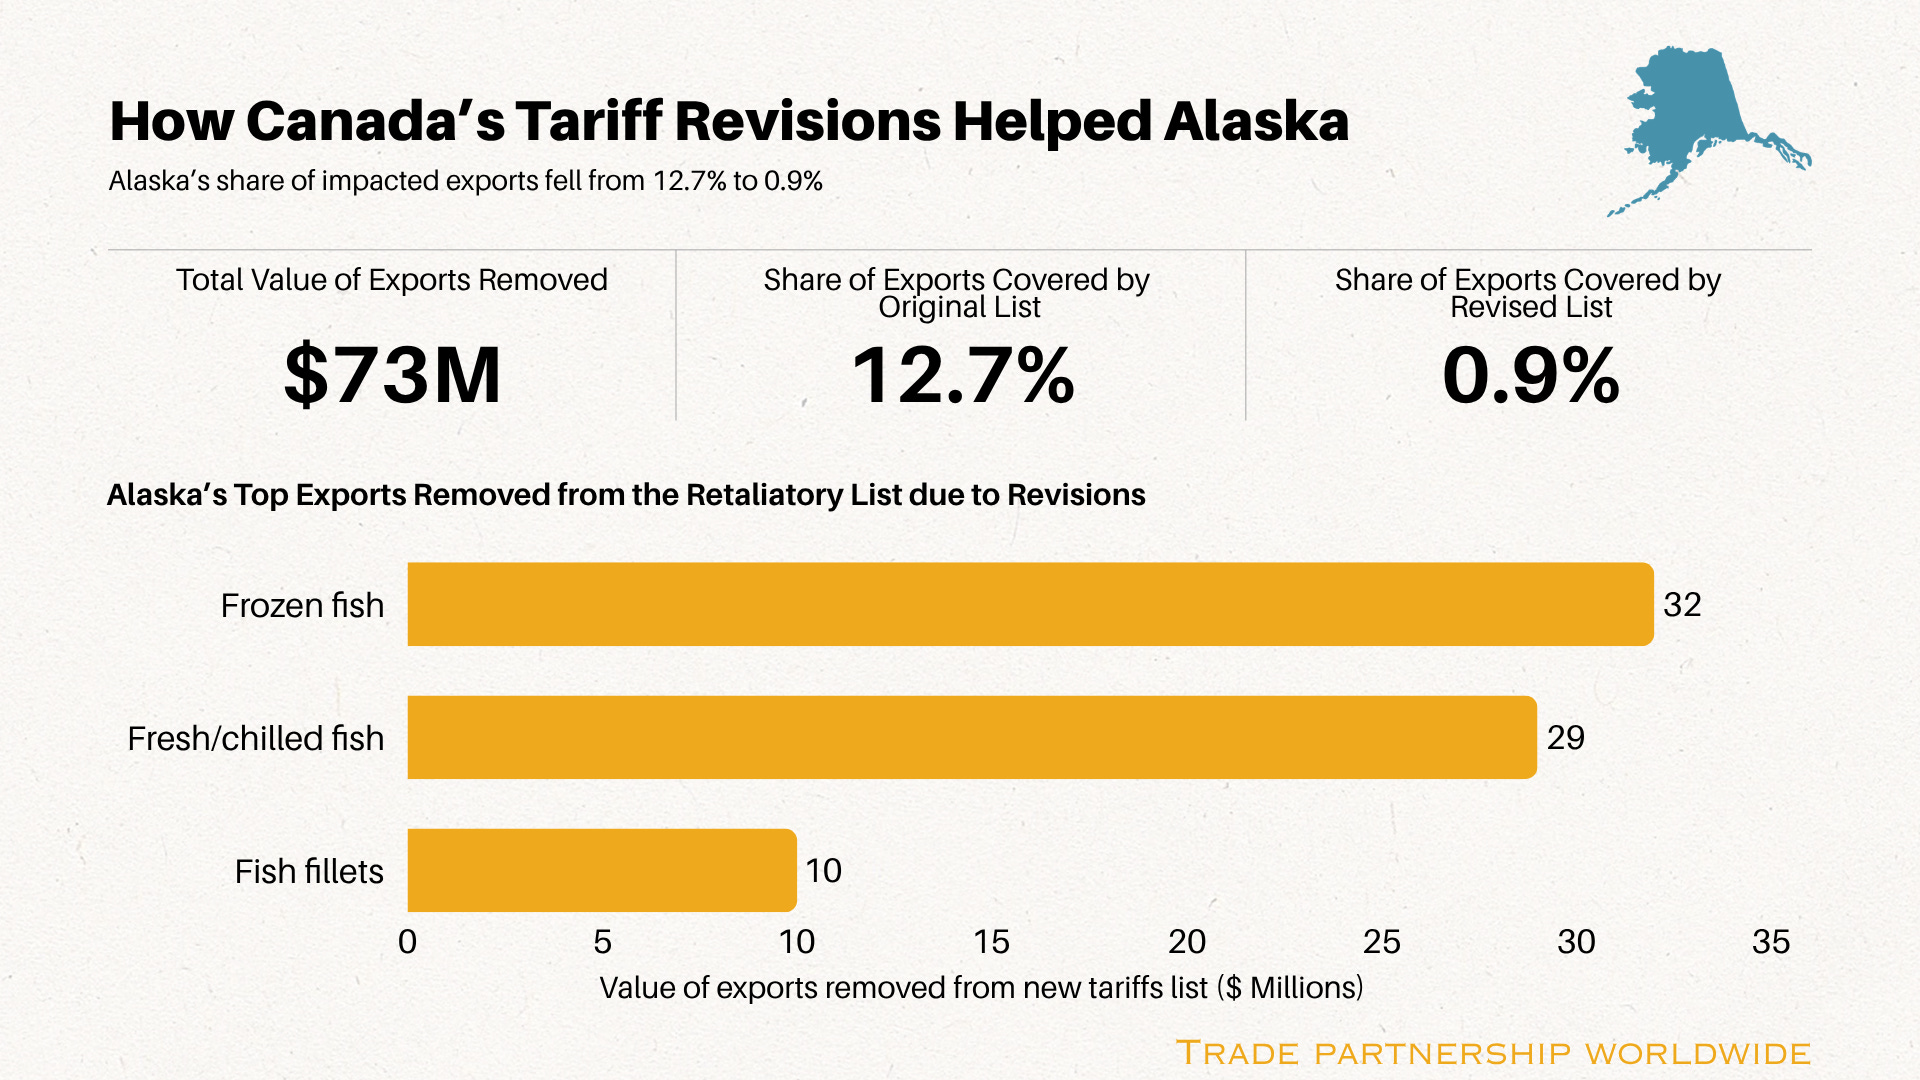
The revision shrunk Alaska’s exports that are subject to tariffs by a factor of almost 15. It fell all the way from the 10th to the 49th most-impacted state by share of covered exports
The top 3 exports that drove 99% of the change were frozen fish, fresh fish and fish fillets, which are Alaska’s 3rd, 4th and 6th largest exports to Canada. Frozen fish exports are primarily sockeye salmon, while the fresh or chilled fish are a mix of halibut and Pacific salmon. It should come as no shock that Alaskan pollock drove the fish fillets exports. Unlike Maine and Washington where there were a small amount of exports that were added to the revised list, Alaska didn’t export any of the products that were added to the revised list.
Who were the big losers from the changes?
New Jersey
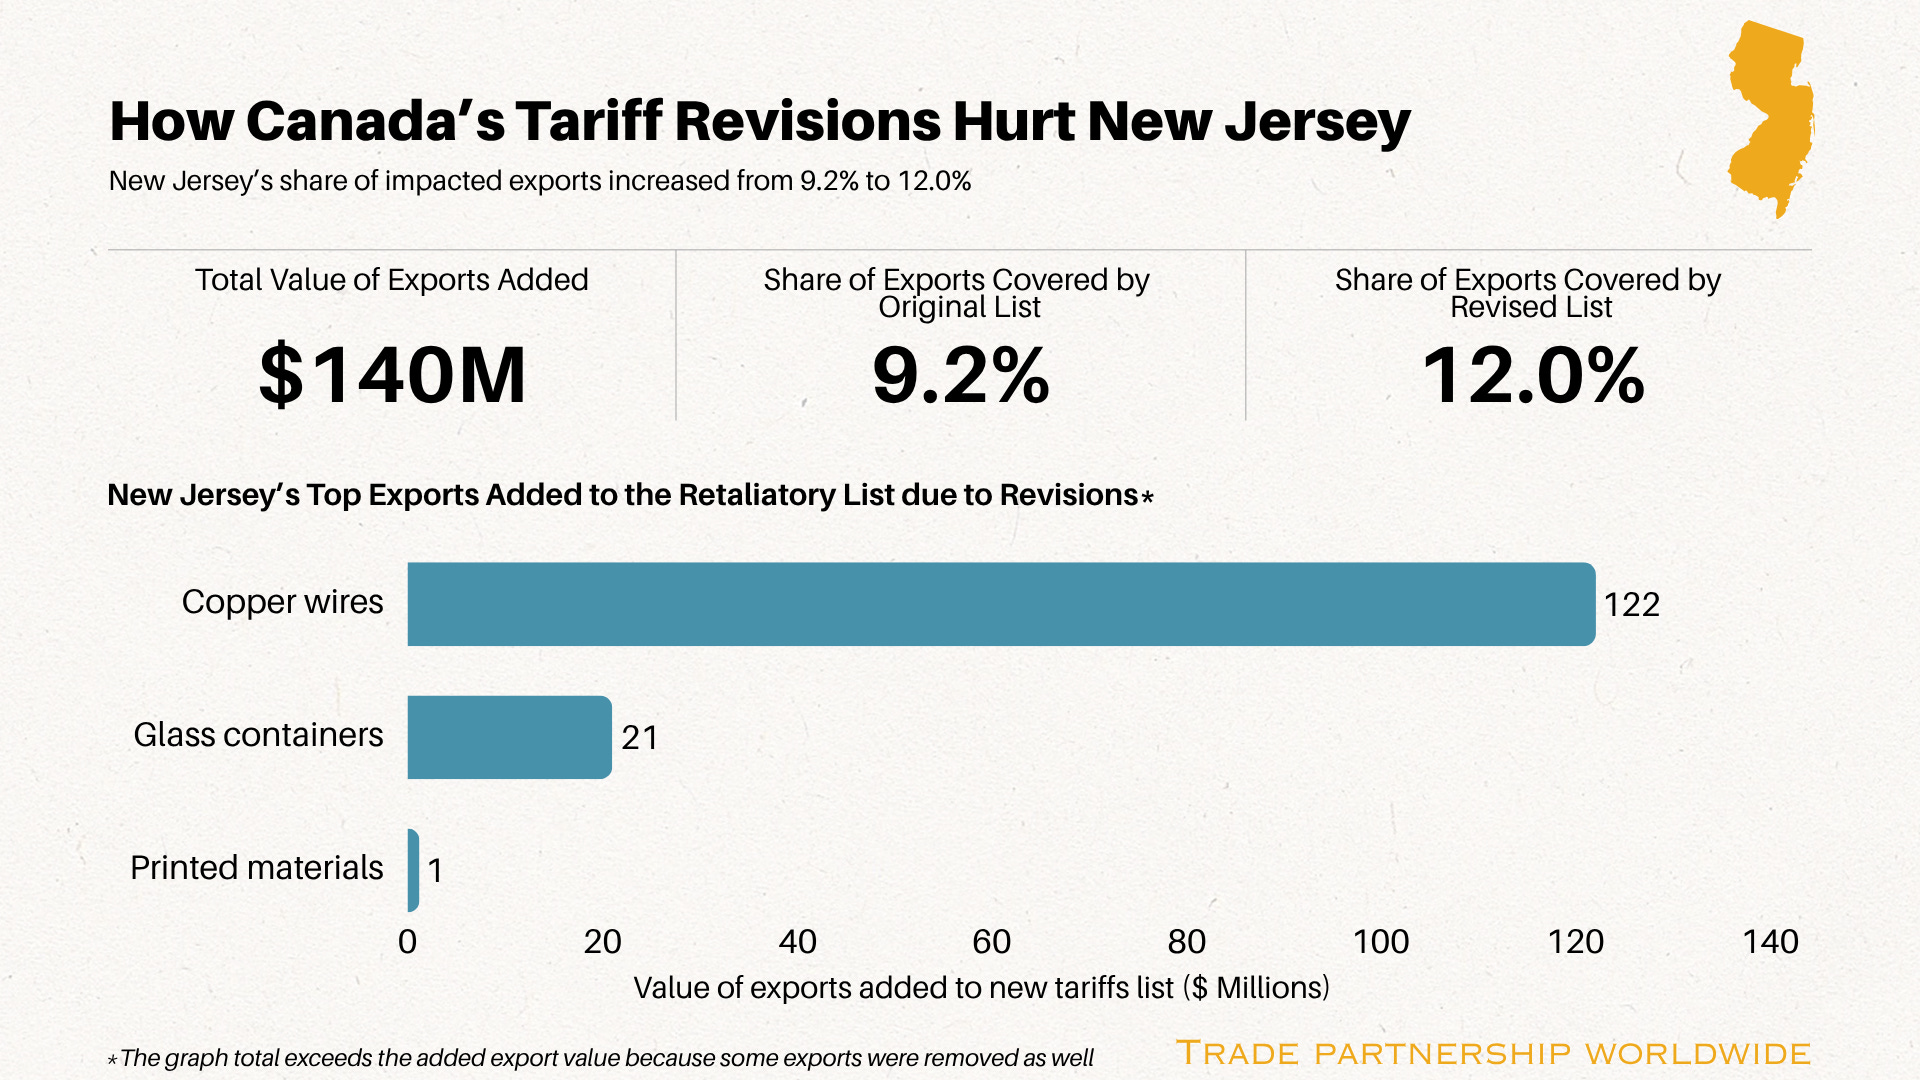
For New Jersey, the list revision added $140 million in exports covered by the retaliatory tariffs, pushing it up from 24th to 12th in share of exports subject to tariffs.
Copper wire was the main driver behind the change, accounting for 87% of the increase. It went from unaffected to New Jersey’s #1 impacted product by a wide margin, with nearly 3x the export value of the biggest product (perfumes) from the original list. Copper wire and glass containers increased the value of covered exports by $143 million, which was only minimally offset by the exemption of $3 million in seafood products. All in all, a very bad trade for New Jersey industrial products exporters.
Indiana
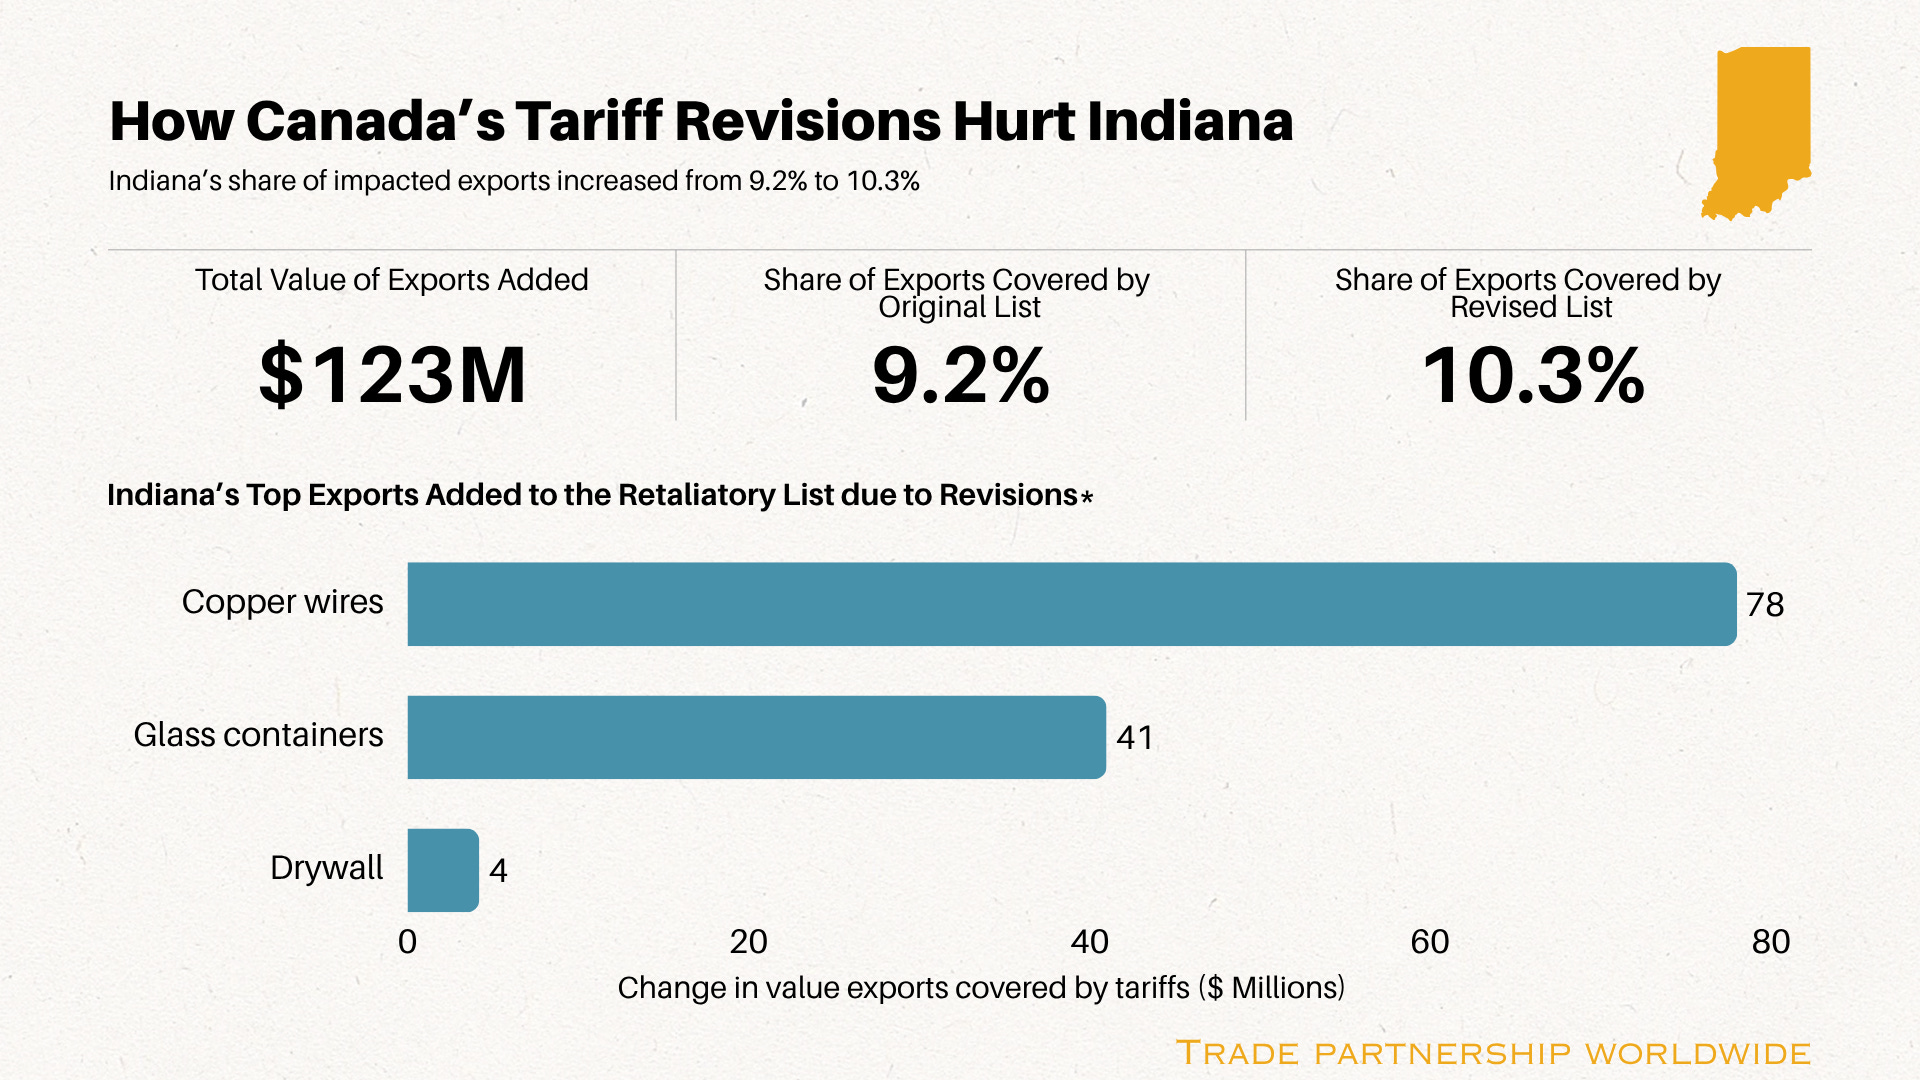
Indiana experienced a $123 million increase in terms of value of exports covered by tariffs after the revision.
Unlike New Jersey, Indiana didn’t have any seafood exports to remove. Copper wire, primarily thicker gauge wiring (e.g., with a cross section exceeding 6 mm) but with smaller amount of thinner gauge wiring as well, is the highest-value addition to the list. Glass packaging products (e.g., jars, bottles, vials) were the next biggest addition, followed by a few million dollars worth of drywall exports.
North Carolina
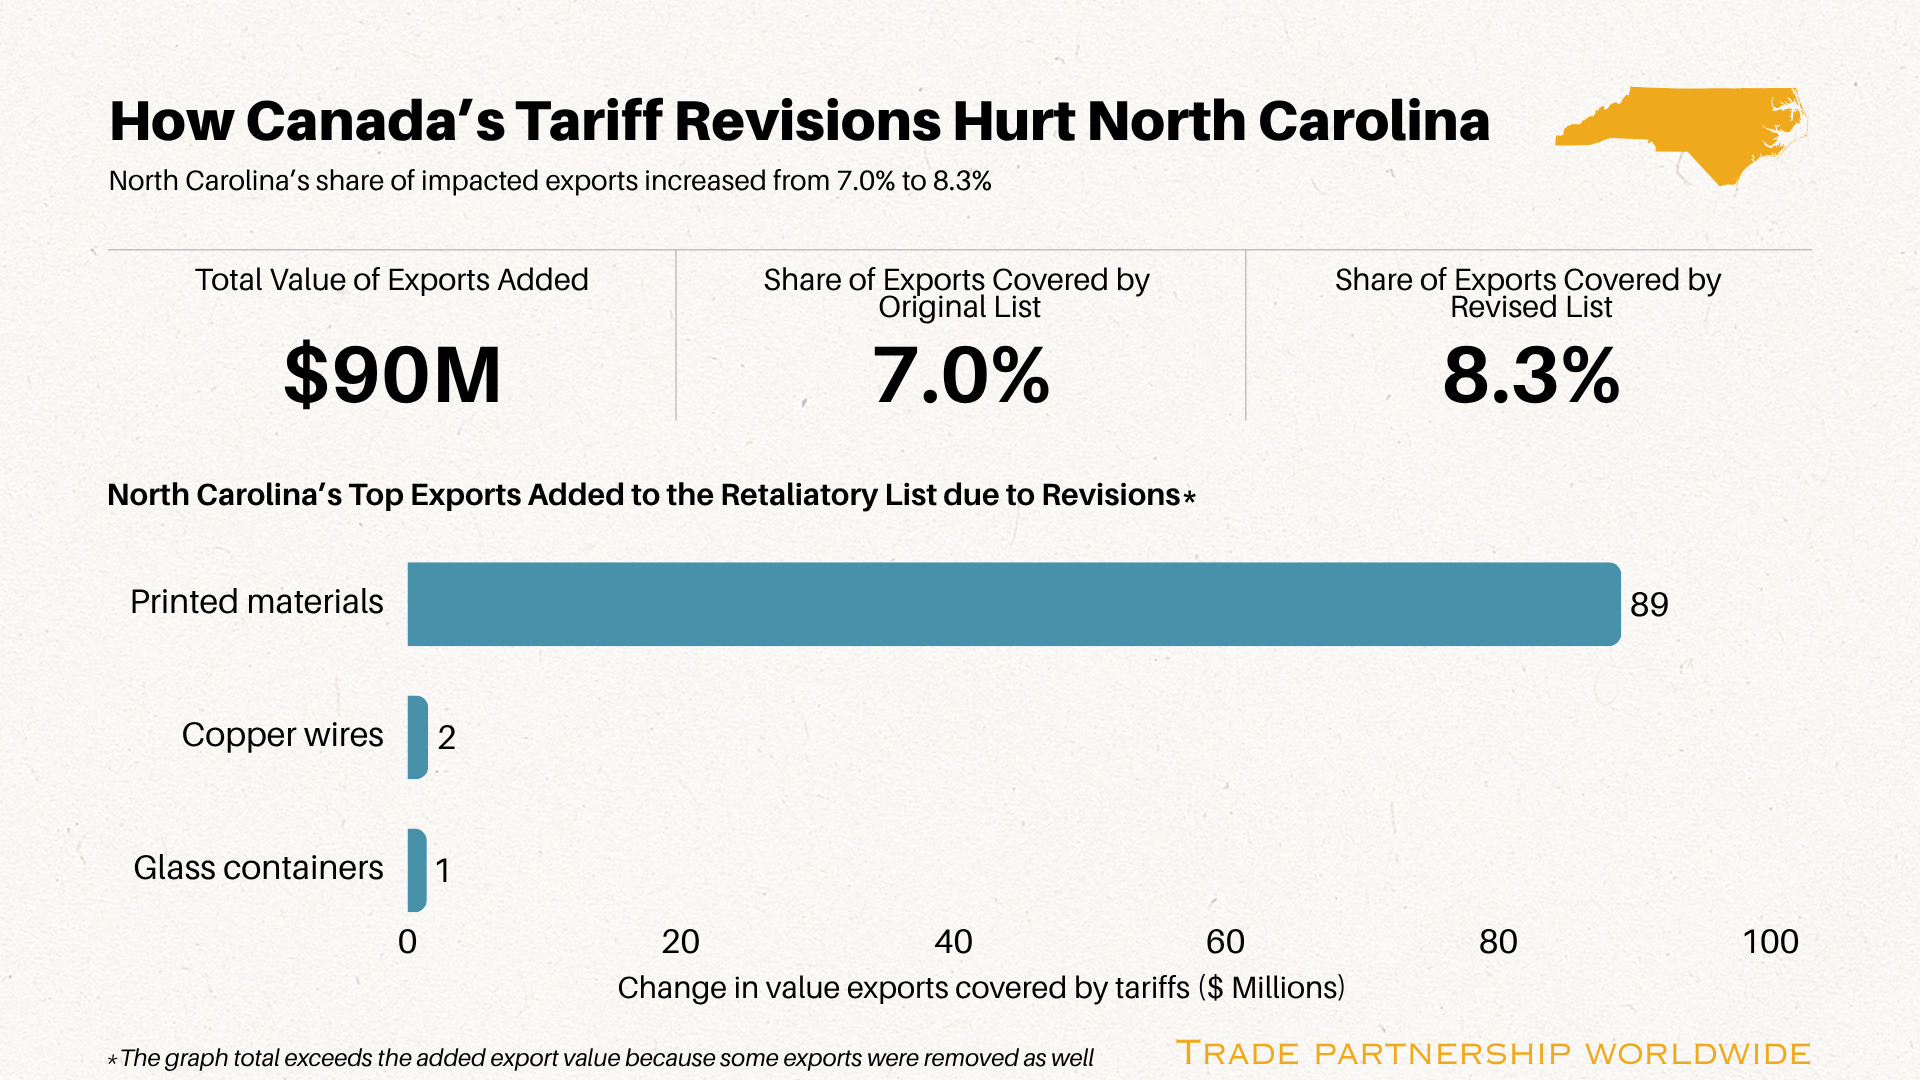
After the revision, North Carolina rose the ranks from 27th to 32nd in terms of share of exports affected. In total, an extra $90 million of annual exports will face tariff retaliation of about 50% due to the revisions.
Printed materials, such as photographs, lithographs, and posters, were North Carolina’s most harmful addition. New tariffs on low values of copper wire and glass container exports were basically offset by small seafood removals. But that is little solace if you’re a photo exporter whose products will suddenly be hit with 50% tariffs in Canada.
Summary
Press reports suggest Canada’s changes were to protect its domestic industry, such as companies that import live and frozen U.S. seafood products, process it in Canada, and export it back to the United States. Yet the changes provided a major break to exporters in states like Maine and Alaska (that also happened to have contested Senate elections). Even if increasing political pressure in the United States was a goal when selecting the original list, apparently kneecapping the Canadian seafood processing industry was a bridge too far.